Election 2016 Social Media Influence Index => Trump Wins
The Social Media Influence (“SMI”) Index was created by ZettaCap, a company I founded that analyzes a variety of social media and on-line data for financial investment analysis. It correctly predicted from 2015 that Trump would dominate the Republican nomination process and that Clinton would win the Democrat nomination but only after a considerable fight with Sanders. The SMI is, to my knowledge, the only purely quantitative indicator that correctly called both nominations, including the impressive strength of Sanders, prior to voting. Its last call before election-day is for a Trump victory.
A very small handful of individuals, such as Scott Adams of Dilbert fame, correctly predicted Trump’s strength using non-traditional forms of analysis. But, almost every pundit and analyst using traditional data and analytics, such as Nate Silver from 538.com, made regrettable forecasts for this election cycle. The weight of evidence is that this election has been extraordinarily difficult for well-known forecasters and pundits using traditional methods of analysis. In this environment, the SMI which is purely based on social media interactions correctly forecast both nomination races.
Currently, we are less than a week to the election. Over the last month, almost every pundit and forecaster has, at one point or another, declared Clinton the winner. This is not to say they forecasted a tight race but in many cases a blowout. About a week ago, most of the major forecasting sites put the probability of a Clinton win at over 90%. At present, Huffington Post puts the probability at 98.4% and 538.com has it at 68.9%. Even with an apparent wider range of forecasted outcomes, the weight of the forecasts still overwhelmingly points to a Clinton victory.
In contrast, the SMI has consistently pointed towards a Trump victory (with the exception of just a few days showing a Clinton lead) for more than a year. Repeating in a slightly different way, the SMI and on-line activity analysis in general have produced the opposite conclusion of traditional analysis which has consistently forecast a Clinton victory in the general election (with the exception of just a few days showing a Trump lead).
So, know before going further that although the SMI and other indicators focused on social media and/or on-line activity performed very well in 2015 and throughout the primaries, they have been at odds with polls, political analysts, and pundits. For some reading, this might be a disqualifier whereas for others it might make these indicators more appealing. Regardless of your pre-election day viewpoint, the outcome of the election will determine much of the future of election analytics.
SMI analysis shows that Trump consistently led Clinton throughout 2015 and through the primary season. In fact, he led to such a degree that we (via ZettaCap) had speculated at the time that it would be highly improbable for Clinton to make up the difference without significant help from well-known and popular surrogates conducting an all-out coordinated social media war on Trump. Well, the Democrats pulled it off. They conducted all-out war on Trump in a highly coordinated fashion resulting in the improbable – Clinton taking the lead for a very brief period.
Much of the remainder of this report focuses on how Clinton’s SMI surged and then fell back and how social media analysis helped to quantify the movements, sometimes in non-intuitive ways. The conclusion, however, is that though extremely impressive, Clinton’s successful September – October social media performance does not appear to have been enough for Clinton to win the election. With less than a week to election-day, SMI points towards a Trump victory.
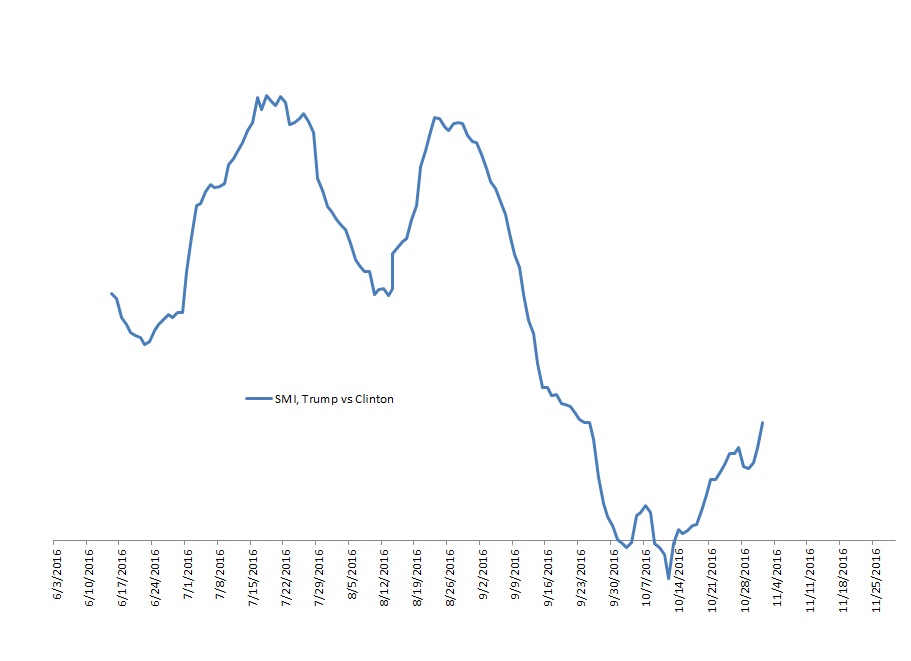
Chart 1: Social Media Influence (SMI) Index, Trump versus Clinton
Source: ZettaCap
This is a relative SMI reading, so up is good for Trump and down is good for Clinton. The vertical line is the zero line, which means that anything above it implies a Trump victory and below it implies a Clinton victory.
There are a number of interesting points from Chart 1. First, Trump’s advantage was impressive in June, July, and August. It was at this stage when it looked like Trump’s social media lead was unassailable or at least extremely difficult to take down. Second, the massive and abrupt decline during September looked like it could remake the election due to its acceleration. Third, for an extremely brief period in early October, Clinton actually held the SMI advantage, the only period in over a year. Fourth, with less than a week to go Trump has wrestled the SMI lead again and it appears inevitable that he will enter election-day at a very similar level, implying electoral victory.
Now, analyzing the events around the SMI movement, we can see when and how social media reacted to events.
Chart 2: Social Media Influence (SMI) Index, Trump versus Clinton, including main Election Events and Social Media Topics
Source: ZettaCap
Anyone familiar with stock analysis will likely recognize this type of chart. Putting events on a chart helps to create context. In this case, many observations can be made but perhaps the main one is that in the absence of negative Trump news, the relative SMI increases in favor of Trump. Put another way, positive news for Trump or Clinton and negative news for Clinton do not appear to have had such a large impact on their relative SMI and on this race. Intensely negative social media talking points and topics push down the relative SMI to Trump’s detriment whereas a neutral environment pushes the relative SMI in Trump’s favor.
The main events and news items that got traction on social media include:
- Republican National Convention
- Democrat National Convention
- Public Trump vs Kahn Fighting
- Trump Attacks — ‘Election Rigged’ and ‘Obama Founded ISIS’
- Trump Visits Mexico
- Clinton Deplorable Speech
- Clinton ‘Medical Episode’
- First Presidential Debate
- Public Trump vs Machado Fighting
- VP Debate
- Trump Access Hollywood Recording
- Second Presidential Debate
- Third Presidential Debate
- FBI Re-Opens Clinton Investigation
The relative SMI performs in Trump’s favor for both major party national conventions. For the RNC, this was to be expected as increased social media activity should be supportive of the candidate around their respective convention. More surprising was that the relative SMI remained strong even during the DNC.
The collapse after the DNC can be traced to Trump’s very public feud with Kahn, or the Gold Star Family. This brought Trump well off topic and allowed for the Clinton campaign to unleash a stream of negative Trump attacks regarding his temperament that were picked up on social media, which quickly punished Trump.
But like most news events and social media topics, this had a relatively short half-life. Social media just lost interest after a few weeks. This is a very important point to highlight in that the SMI is sensitive to shifts in topic focus and topics, whether sourced from news or otherwise, are not able to maintain social media attention for that long.
As the Kahn and Trump feud lost steam, Trump began new attacks – election could be rigged and Obama ‘created ISIS’. Number 4, more or less coincides with the short-term low of the relative SMI for Trump and the beginning of these new attacks. It seems that in the absence of very toxic Trump news, the SMI tended to move higher. Or, put another way, as long as the Democrats did not control the social media talking points and as long as those talking points were not negative for Trump, the relative SMI trended in his favor.
Trump’s trip to Mexico more or less marked the next major high. Afterwards, there was a significant amount of confusion concerning where Trump stood on immigration which turned out to be a major negative on social media for Trump as much of his early campaign was built around this concept. Questioning from many of his supporters on social media began this sharp decline which only accelerated.
Clinton’s deplorable comment came soon afterwards. Initially, you might expect that this would be a negative for Clinton, but on social media, it actually turned out to be a positive as it tended to energize her supporters. Though the deplorable pass might appear somewhat counterintuitive, the next event likely wins the most counterintuitive award. Clinton’s fall or ‘medical episode’ appeared like a huge red flag for anyone watching the race as it thrust her health to center stage. But, social media reacted in a positive way for Clinton. Many influential surrogates came out to support her en masse.
This was one of the great turning points for the entire election from a social media context. Influential Democrats came out and rallied around Clinton, turning what seemed like an obvious negative for her into a very strong positive. If Clinton would have received such support if she had not fallen is unknowable, but certainly when it looked like the Democrats’ chances were about to implode, many influential surrogates came out extremely strongly in her favor as did her supporters on social media in general. In a counterintuitive way, this event appeared to have woken up her supporters to the fact that she could lose the race and it accelerated Trump’s relative SMI decline as they became more active and vocal.
The first presidential debate in most ways appears to have been more or less a tie. This could have marked the low for the relative SMI’s decline. But, the Democrats quite brilliantly inserted a new topic within the debate. Clinton mentioned Machado, Miss Universe 1996, during the debate and Trump’s apparent treatment of her. Trump began a very public feud over the topic. Social media latched onto it and the talking points of Trump’s temperament and ‘problem with women’ intensified.
For the first time during the entire election season, Clinton led in relative SMI. Topics on social media at this time were almost universally negative for Trump. Again, with hindsight, it appears that the negative Trump topics will define how the general election developed on social media as they appear to have had the largest impact. While the Democrats could control the social media talking points and frame them as negative for Trump, they could control the outcome.
For the Republicans, the turning point or the point at which the bleeding stopped was the Vice Presidential Debate. As measured on social media, Pence defeated Kaine in this debate but this is less important than the fact that it changed the tone of and topics on social media regarding the race.
Within just a handful of days, however, the Trump Access Hollywood bomb was dropped, at point 11. If its release was coordinated or random is not known. If it was planned it should be seen as another politically brilliant move by the Democrats. Just days before the second debate, it was likely meant to overshadow any chance that Trump might have had to get any traction. The fact that the Machado and Access Hollywood events can be seen as the same talking point – ‘Trump treats women poorly’ – it seems coordinated. Soon after its release, a string of Trump accusers came forward which also received attention on social media.
From a traditional political analysis standpoint, you could expect this to be the end of the election. But social media surprised again showing the second debate to be the low for Trump’s decline. This talking point had run its course. As mentioned earlier, social media has a short attention span and topic half-lives are fairly short.
While this was occurring, the Democrats pulled off another brilliant move by deploying their strongest surrogates and goading well-known Republicans to ‘denounce’ Trump. This was extremely well executed, and from most political pundits’ viewpoints the race had been lost by Trump.
From a social media perspective, however, you can see the timing for one of the most insightful calls during the entire election. During this firestorm of negative Trump news, the relative SMI began to increase in Trump’s favor.
This is very similar to the concept in finance that if a stock starts to go up after a slew of bad news it means the market has already incorporated that news and it is time to buy. This might appear somewhat counterintuitive but if you think about it from a news exhaustion perspective it might make sense. At some point after a decline, the reasoning for the fall will become overly priced-in and the repeating of the reasoning will cease to have any effect.
For Trump, social media hit an exhaustion limit with the talking point of Trump’s relationship with women and apparently on his temperament as well. Perhaps the Democrats played their hand too strongly as questionable Trump accusers started to appear which could have inadvertently produced a shift in interest on social media.
At this stage, the Democrats had done everything they needed to do. They coordinated a strong social media counteroffensive leveraging their party’s best assets – their influential individuals. They also (apparently) timed the creation of talking points that had a very similar theme of Trump’s treatment of women (which surely not coincidentally ties in nicely with the Democrat’s background theme of helping to make Clinton the first female US President). And, they successfully kept Trump on the defensive on social media not allowing him to effectively start new topics.
Under these conditions, it looked like it was an even race on social media. But, it seems that the Democrats ran out of ammunition. And, in the absence of new negative news for Trump, his relative SMI would increase. This is not a new observation but one that was highlighted multiple times in previous reports. His SMI is very strong and he is very influential on social media. All things being equal, he is much more influential than Clinton. With the help of the aforementioned (presumably) well-coordinated plan, Clinton was able to take the lead (or perhaps more accurately stated is ‘able to pull even’), but once things began to stabilize Trump’s naturally stronger SMI would take over. In other words, Clinton’s SMI could overtake that of Trump only under specific and aggressive conditions and once they had run their course, Trump’s relative SMI would improve again. A visual for this is that of holding a ball under water, you can do it but once you let the pressure off it bounces up to the surface again.
By the third debate, or point 13, it would have taken a new unexpected bomb similar to the Access Hollywood recording to create another decline. In its absence, social media just seemed bored with the ‘old’ topics. A strong search was made to find a new detrimental topic that could get traction on social media. Trump apparently not having paid taxes for years was hit. His temperament was hit with repeated reference to not wanting to provide nuke codes to someone with such a temperament (interestingly Trump called Clinton out on the fact that she must be running out of material as that topic is old, Trump appears to have known that the topic had run its course). And, some extremely low blow type mud-slinging accusations were floated. But social media was either tired of these topics or uninterested.
In this environment of existing topic exhaustion on social media, the FBI re-opened its case on Clinton’s emails, or point 14. As an unexpected and completely new topic, it quickly gained traction on social media. Given its initial traction, it looks to remain as one of the main social media topics up to the election. Barring an unexpected bombshell against Trump, it looks like the relative SMI should settle in around current levels for election-day, meaning Trump would have a considerable advantage.
Next, we’ll answer the question that everyone always asks – how do polls and SMI compare and which is leading?
For comparison, we will look at the RealClearPolitics (RCP) average Clinton lead in a 4-way race. For the SMI, we use the same data as in the previous charts but invert the comparison so that it is Clinton versus Trump such that an increase is positive for Clinton in order to match the directional tendency of the RCP polls which are shown from Clinton’s perspective.
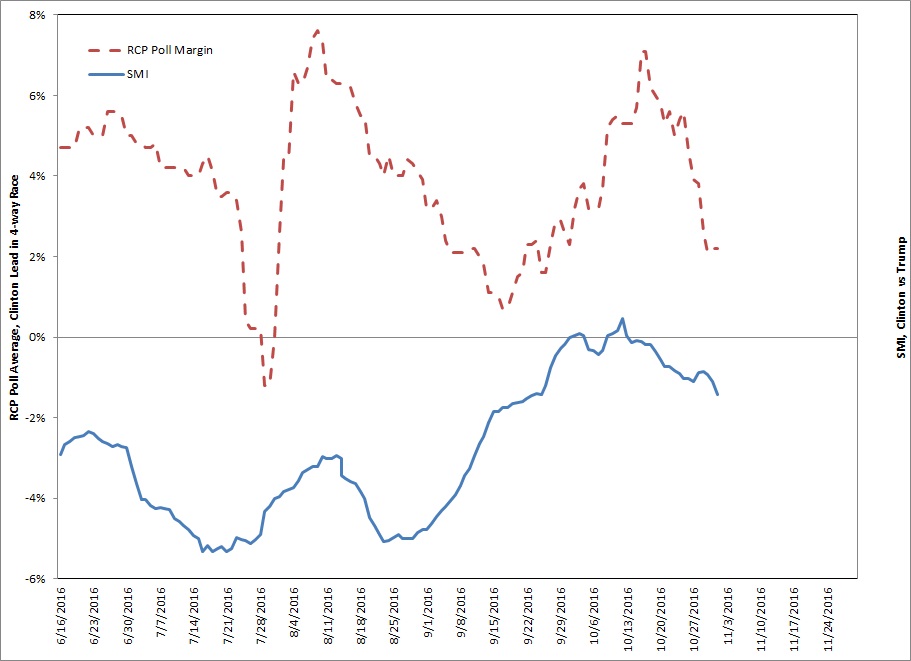
Chart 3: RCP Clinton Lead in 4-way Race, left scale, compared to Relative SMI of Clinton vs Trump, right scale
Source: RCP and ZettaCap
Each dataset is on a separate axis, but the zero (horizontal) line is the same on both. For the RCP poll data, Clinton leads the entire period except for a brief time that Trump took the lead. The relative SMI data shows the opposite in that Trump is depicted as being in the lead with the exception of a brief Clinton lead.
Using the SMI, you get the impression that Trump has dominated the entire election except for a period in early October. Using just this data, you would likely assume that Clinton gave an admirable run, but that the election will go to Trump as he has led for almost all of it as well as going into the last week.
Using just the RCP poll data, you get the impression that Clinton has dominated except for a period in late July. You’d likely assume as she has been so dominant during the race that Clinton would win even if her lead has declined recently.
These two opposing views of the race paint very different pictures. As we are so close to election-day and as these indicators are still fairly far apart, this chart highlights the difference of these analytical methods.
Although very different in terms of determining which candidate has the advantage, the directional movements of both indicators more or less produce the same pattern. This is very important as it shows that, though one shows a Clinton advantage and the other a Trump advantage, both are working off of similar underlying factors. To more closely see this, we can change the axis so that they are overlying each other.
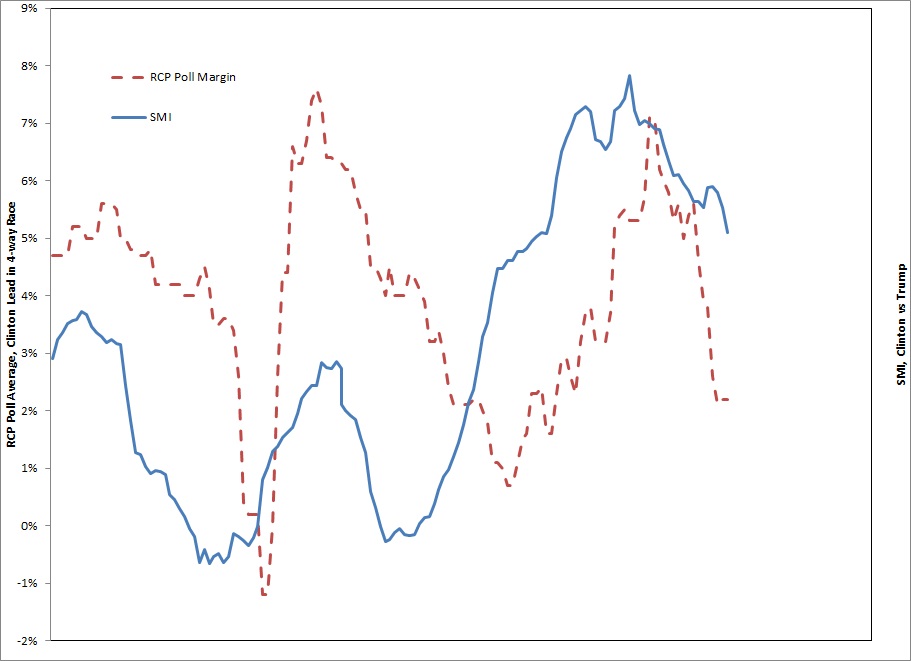
Chart 4: RCP Clinton Lead in 4-way Race, left scale, compared to Relative SMI of Clinton vs Trump, right scale
Source: RCP and ZettaCap
When these time series are superimposed, you can see their similar trends. It does look like the SMI tends to lead the poll data. In the next chart, the SMI data is pushed forward by one week to see how it looks.
Chart 5: RCP Clinton Lead in 4-way Race, left scale, compared to Relative SMI of Clinton vs Trump, right scale, SMI pushed forward by 1 week
Source: RCP and ZettaCap
By pushing the SMI one week forward, the fit with the RCP poll improves. Though this is limited data, we saw similar results during the primaries in that the SMI preformed slightly ahead of the polls.
So, answering the basic question of SMI’s ability to lead polls, it seems like it does act like a leading indicator in terms of direction changes.
Separately, and just as important, is the question of which provides a stronger indication for which candidate is actually leading, polls or SMI. We will know that very shortly depending on the election’s outcome.
Another strong forecast that ZettaCap made earlier in the year based on SMI analysis was that third parties would underperform their respective poll figures. The SMI of the Libertarian and Green candidates showed low social media influence which did not make a lot of sense given that their core constituents were young who naturally have a higher likelihood of using social media. In other words, these third parties should have been scoring unusually high not low on social media based metrics. It turns out that the SMIs of both Johnson (Libertarian) and Stein (Green) have fallen dramatically over the last few months.
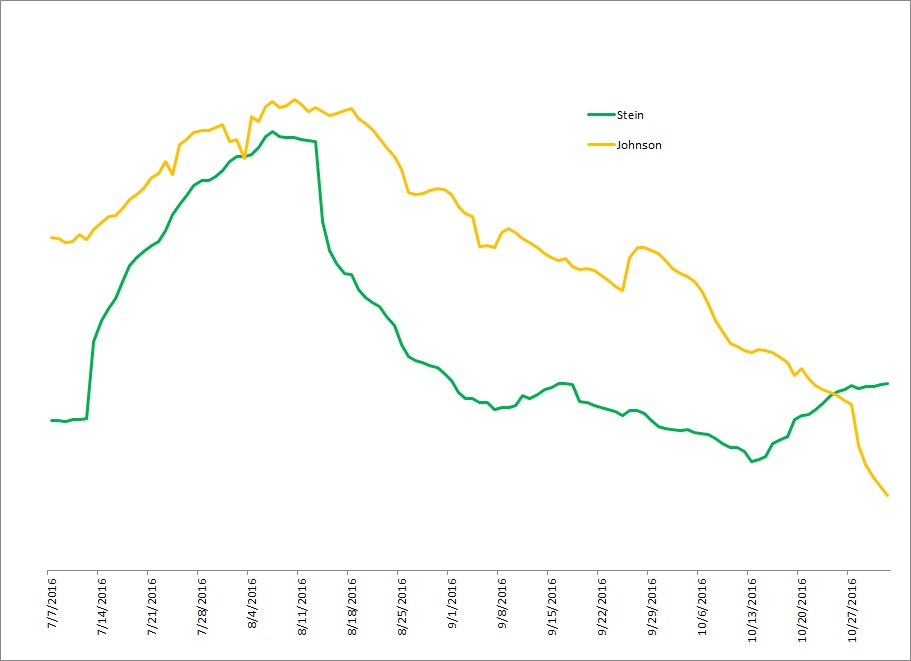
Chart 6: SMI of Johnson (Libertarian) and Stein (Green)
Source: ZettaCap
Two points stand out. First, the SMIs for both third party candidates have declined significantly from end-July. Both candidates generated social media attention during the RNC and DNC but were unable to sustain those levels of social media influence. From a social media perspective, both candidates are expected to receive a fraction of their peak poll levels from the summer. Polls have partially reflected this as the third party candidates’ poll results have been declining. The SMI, however, forecasts even more dramatic declines. Perhaps more surprising is the recent decline of Johnson (Libertarian). For the first time, his SMI is significantly below that of Stein (Green). Though both third party candidates are expected to perform well below poll forecasts, the rapid fall in Johnson’s SMI right before the election should result in more surprising underperformance for him than Stein.
Summarizing, the SMI continues to make out-of-consensus calls, currently forecasting a Trump victory in the general election. This forecast is in complete contrast to the vast majority of polls and pundits who heavily lean in favor of Clinton. Providing a significant amount of weight to the SMI analysis is that it performed very well in 2015 and during the primaries in contrast to others. The SMI also continues to call for third parties to well underperform their respective poll figures, with the largest negative surprise forecasted for Johnson (Libertarian).


