Election 2016 Google Searches during Debates, advantage Trump
As discussed in different posts and research, on-line activity is an excellent determination of interest level which, in the case of a political election, is a good indicator for voting intention and turnout.
In the last three US Presidential Elections the candidate with the more dominant Google search trend won the election. Currently, Trump has been leading for almost the entire election season, so from this single variable, he is seen as having a significant advantage.
Applying this same logic to the US Presidential Debates, we can determine who ‘won’ the debates as well as which candidate has shown the most positive momentum, both of which will be very important in helping to forecast which major candidate will receive a greater percentage of the undecided vote on election-day.
By almost every metric derived from search data, Trump won the debates. Which candidate won the debate certainly does not seem to be a settled topic as many snap polls by polling agencies showed Clinton winning while on-line polls or surveys showed Trump winning. So, there is fodder on each side for argument. However, judging purely from Google Search which can be assumed to measure at the very least interest, Trump held the advantage in each of the three debates.
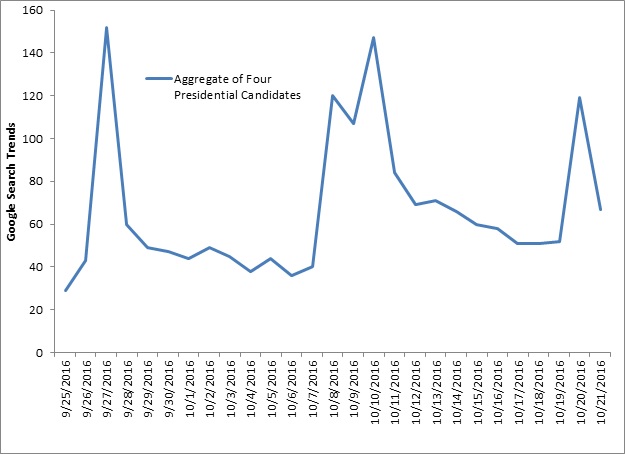
The following chart shows the aggregate of the four main US presidential candidates over the last month. The candidates are Clinton, Trump, Johnson, and Stein.
Chart 1: Aggregate Google Search Volume for Four Main US Presidential Candidates, September 25, 2016 to October 25, 2016
Source: Google Trends
The timing of the debates coincides with the spikes in Google searches for the candidates. We can very obviously assume that viewers of the debates, which averaged 74 million people, took to Google when curious about one of the candidates, thereby explaining the spikes. These searches clearly indicate interest in the candidate.
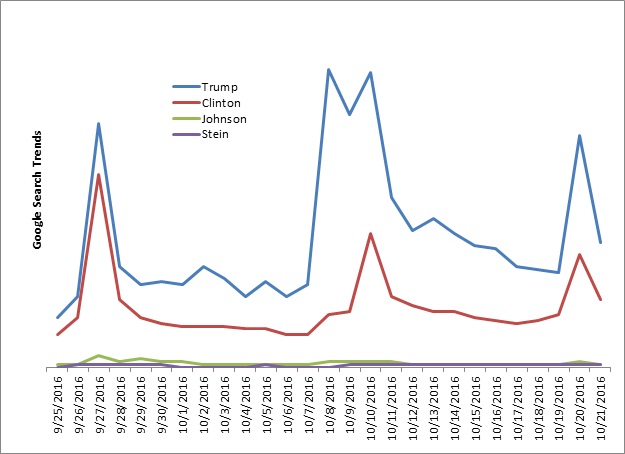
Chart 2: Google Search Trends by US Presidential Candidate, September 25, 2016 to October 25, 2016
Source: Google Trends (all trends using United States as the geographic determination)
This second chart shows how the Google search trends break down by candidate. Trump’s trend remains relatively strong throughout whereas Clinton, as well as the candidates from third parties, decline throughout. The general fall of the aggregate trend in Chart 1 is mostly due to declining search interest for Clinton.
There are counter arguments to using search trends as an election indicator. Likely the most viable one is that search could indicate simple curiosity and not support. This is true and is reflected by Trump’s spike just prior to the second debate which coincided with the release of the Hollywood Access tape. Additionally, an argument could be made for there being more search interest in Trump as he is newer to politics than Clinton, which is also viable and implies curiosity as well. However, Kerry in 2004, Obama in 2008, and Romney in 2012 were all less well known than their opponents and it does not appear to have significantly impacted search trends for these candidates in comparison to other candidates.
In general, search trends are negative for Clinton as they show absolute search level declining in each successive debate and her search trends being relatively lower than those of Trump. On a state-by-state basis, search trends could show even more ominous signs for Clinton as they point to traditionally blue states and swing states searching heavily for Trump. Again, this could partially be explained by curiosity but it seems unlikely due to it consistency and growth. In other words, if the race was overly lopsided in favor of Clinton, it does not seem logical that so many people would essentially waste their time searching for Trump. And, if they did do such searches out of pure curiosity, you would expect it to run out of steam and certainly not increase on a relative basis.
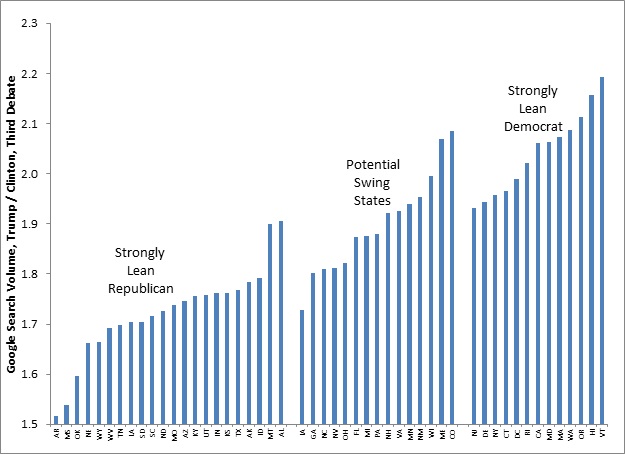
Chart 3: Relative Google Search Volume of Trump / Clinton around Third Presidential Debate, by State
Source: Google Trends
Note: The calculation took the average of three periods around the third debate, the day preceding the debate, the day of the debate, and the day after the debate to take out potential distortions.
On a state basis, traditionally Democrat-leaning states search at a relatively higher rate for Trump in comparison to Clinton during the period around the third debate. The previous chart is broken down into groups of expected voting behavior. The fact that swing and blue states show signs of high interest in Trump could be worrisome for Democrats. Remember that many undecideds will look for more information on the candidates during the debates, so a relatively lower search index could spell trouble for Clinton attracting those undecideds especially in bluer states. Though speculative as polls continue to show Clinton well ahead in many of the swing and blue states, a late lean towards Trump from undecideds could produce a usually strong performance in such states.
The counter argument here again is curiosity. Many individuals in more Democrat-leaning states might not know that much about Trump and might simply be curious about him. This could be accurate, but given the data available it seems unlikely. In addition to the fact that Democrat-leaning states tend to have higher Trump search volume in relation to Clinton search volume, such a ratio increased the most from the first to third debate in Democrat-leaning states.
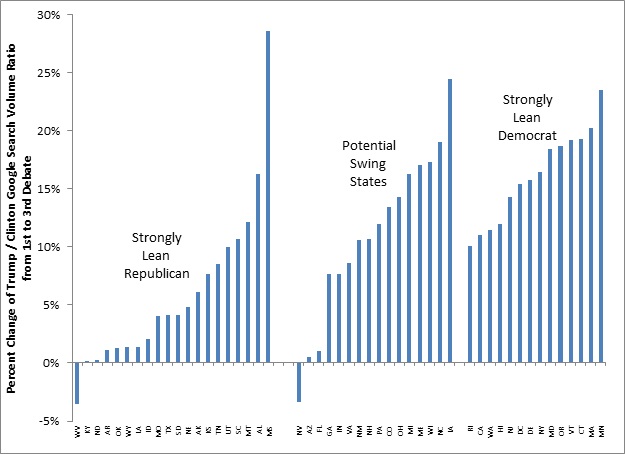
Chart 4: Percent Change from First Presidential Debate to Third Debate of Relative Google Search Volume of Trump / Clinton, by State
Source: Google Trends
Looking at growth data, we can see that states that have a greater affinity to Democrats tend to have increased their relative searches for Trump more than other states. This seems a little odd in a way, especially considering state level polls showing Clinton way ahead in many of these states, which will be covered shortly.
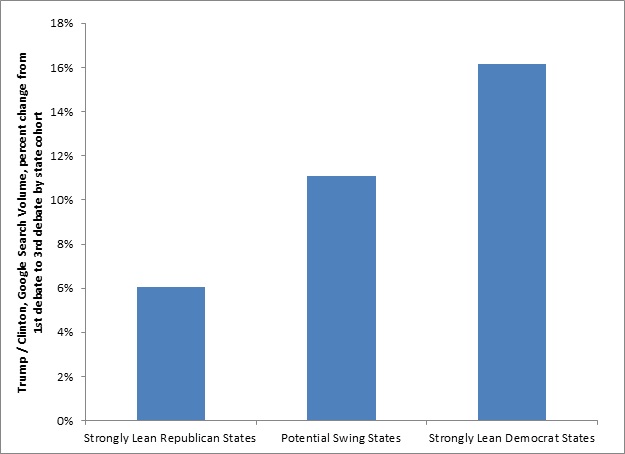
Instead of looking at individual states, we can group the states into specific groups to make the analysis easier. The following chart shows the same data as the previous chart but averages were calculated per cohort.
Chart 5: Percent Change from First Presidential Debate to Third Debate of Relative Google Search Volume of Trump / Clinton, presented by major party lean cohort
Source: Google Trends
Now, placing the data into cohorts and averaging the data per cohort, it becomes extremely apparent that there was a strong trend towards increasing interest in Trump relative to Clinton as measured by search volume between the first and third debates.
If such analysis is correct, it provides a potential late and ‘unexpected’ boost for Trump especially in multiple swing states. This essentially shows that states that there could be a large growth in interest for Trump exactly in the states where he trails. Not only could this make the race much tighter than currently expected (almost all analysts forecast an easy victory for Clinton), but it could change much of the electoral map that many consider fairly immovable.
This late surge in interest for Trump is not confirmed by polls and can be explained in two ways – Social Desirability Bias and demographic make-up of each state.
In other posts, we observed that the Social Desirability Bias, as measured by the difference between live interviewer polls and more anonymous polls, was greatest in traditionally Democrat-leaning states. In other words, in those states there seems to be a greater number of people who keep their interest or even inclination towards Trump private.
If this turns out to be confirmed in voting then the above data seems relatively easy to explain. ‘Likely Voters’ who are interested in Trump, but perhaps not traditional Republicans or those who normally don’t vote, would watch the debates and might search for the candidate in which they are most interested. These voters, as not traditional Republicans, likely would not have voted in the primaries and might not know that much about Trump and would likely end up searching for more information during the debates.
A surge in interest in Trump as measured by search but not reflected in the polls in swing and bluer states could be explained via Social Desirability Bias. Essentially, many (rightly or wrongly) feel shame to publically support Trump especially in a traditionally blue or swing state and would be much less likely to admit it in public or in a poll. We saw this phenomenon play out in the primaries as a Trump shaming discount was much higher in blue states than red states whereas Kasich, a much more liberal Republican, actually experienced the opposite effect of people publically saying they intended to vote for him but did not. As this relates to search, a spike in interest in such blue and swing states might simply reflect the ‘closeted’ Trump supporters, or at least those harboring serious interest in the candidate, who want to learn more and are more willing to do so privately at their computer than in public, through conversation with neighbors, or through their local news – all of which will be biased against Trump if the Social Desirability Bias is in fact accurate. These ‘geographically-challenged’ Trump supporters, in this scenario, watch the debates and search for information in private.
A second explanation of why interest is surging in particular states is based on state demographics.
As discussed in other posts, Trump tends to poll very poorly with minorities but very strongly with whites without college degrees. Republicans have generally not received a lot of support from minorities, so this is no surprise. But, Trump appears to have hit a nerve with whites without college degrees and is doing much better with them than previous Republicans. This could shake up the traditional electoral map in that states with a high percentage of this swing demographic. If correct, most analysts would be shocked for the high support for Trump in such states.
Though many might think that such an inclination would certainly be picked up in state polls, this is incorrect. As this demographic normally has lower turnout (which has also been declining) a substantial increase in voter interest has been under counted, making state polls reflect traditional voter turnout mixes. In other words, whites without college degrees are likely being extremely under counted in polls whereas other demographics are being over counted due to exceptionally enthusiastic voter interest from such groups during the Obama elections.
We can measure the degree to which there might be a surprise in a state by looking at this demographic group’s share of the population in relation to minority groups. The calculation used is the percent of the 2016e population of whites without college degrees minus the percent of minority population. So, if a state has 39% whites without college degrees and 20% minorities, then the result would be 19%. The higher the number is, the greater the potential for a positive surprise for Trump. Conversely, if this number is negative or very low, it implies that whites without college degrees might not make up that much of the population to significantly change the outcome, even if the demographic group’s turnout skyrockets.
For analyzing search volume trends on a state level, we can compare this demographic indicator with the percent change from first presidential debate to third debate of relative Google search volume of Trump / Clinton. In other words, we can compare the degree to which a state has a demographic base potentially supportive of Trump and the growth of search volume between the debates.
Chart 6: Potential Swing States, Percent Change from First Presidential Debate to Third Debate of Relative Google Search Volume of Trump / Clinton compared to Percent of State’s Whites without College Degree Population minus States Minority Population
Source: Google Trends, Cook Political
It seems like much of the increase in Google searches for Trump relative to Clinton between the first and third debates can be explained by the state’s demographic make-up. If the potential swing states have a relatively high percentage of whites with no college degrees as compared to its minority population, then it seems like it was more apt to experience a surge in searches for Trump relative to Clinton. Put in plain English, it looks like ‘uneducated whites’ explain the late surge of interest for Trump.
The fact that this comes so late in the race should worry Democrats as it would appear that surge in interest could indicate voter intention. Again, it does not look like this information is reflected in polls which are generally heavily weighted towards historical turnout models. And, as the whites without college degree demographic has historically had a low turnout which has actually declined during the last few US presidential elections, it has been mostly ignored by analysts. This has an effect of underestimating the support for Trump in these swing states that is assuming you believe that this demographic will in fact turnout at levels much higher than unusual.
Though it is not usually recommended to over-analyze the data, we can improve upon the previous analysis by taking out the African-American vote. As explained in other posts, this demographic group was extremely instrumental in electing Obama in 2008 and 2012, with its voter turnout surging to record levels. In fact, in 2012, the female African-American group registered the highest voter turnout of every major group. However, the African-American demographic posts declining interest in the 2016 election as compared to previous elections, which seems to match any common sense analysis in that this group was extremely motivated and excited with Obama as the candidate but appears less so with Clinton. The fact that this group had exceptionally high turnout the last few elections and now is showing lower interest levels leads us to believe that this group’s relative turnout will decline in 2016. As such, as a voting block, the group’s impact on the election will likely be neutral to negative for Democrats.
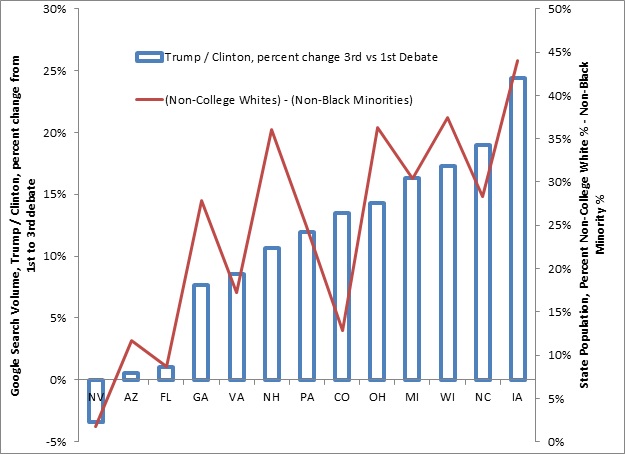
Using a second demographic variable of whites without college degrees minus non-black minorities shows an improved relationship with the growth in search trends for Trump.
Chart 6: Potential Swing States, Percent Change from First Presidential Debate to Third Debate of Relative Google Search Volume of Trump / Clinton compared to Percent of State’s Whites without College Degree Population minus States Non-Black Minority Population
Source: Google Trends, Cook Political
Increasingly, it looks like the surge in relative interest in Trump as measured by search volume can be explained by demographics.
In terms of forecasting, it looks like states such as NV, AZ, and FL will not likely produce any major election-day surprises. For these states, you can depend more on state polls – though it is highly recommended to use more anonymous polls and not live interviewer polls. In short, the demographic make-up of these states does not appear to hold the seeds of a large surprise and the Google search trends confirm this conclusion.
In the middle are VA, CO, GA, and PA. These states have demographics that lean towards a potential surprise but did not produce a significantly high growth in Trump searches to make that definitive conclusion. If anonymous polls show a margin of victory within a few percentage points, this late surge in interest for Trump will likely be enough to push these states in the Republican column.
The group with the highest likelihood of ‘surprising’ in favor of Trump includes IA, WI, OH, NC, MI, and NH, in descending order. All of these are potential swing states, possess demographics that lean heavily towards Trump, and have posted increasing interest in Trump as measured by search trends. As polls are very tight in IA, OH, and NC you can expect that this supportive demographic make-up and surge in interest will result in wins for Trump – that is, these factors which most are not paying attention to will likely be enough to decide close races. The cases of WI, MI, and NH are not as clear as polls in these states are not as close. In a high voter turnout scenario, these states will likely go Trump due to the supportive demographics and proof of increasing interest in the candidate. However, recent polls point towards Clinton and historic US presidential track-record points towards Democrats, only a very high turnout scenario will likely result in Trump picking them up.
Looking at Google search trends together with state demographics makes you rethink the potential electoral map. If you assume a very high turnout election, which seems like the most plausible scenario, then search trends and demographics foreshadows a surge for Trump not reflected in current polls. Under such a scenario, we would expect IA, OH, NC, WI, MI, and NH to all go for Trump. This would not, however, be enough for a Trump victory starting from the 2012 actual electoral state results. Trump would require one or more of the current swing states with too-close to call poll margins (such as FL, CO, or NV) or require one or more of the aforementioned states with marginally supportive demographics and search trends (VA, PA, or CO) to pull off a victory.
Summarizing:
- Google search trends show that Trump won each of the three debates in that more people showed interest in him as a candidate by searching for more information on him during the debates, such a ‘victory’ has little to do with content or debate style but just interest,
- Google search trends show that interest in Clinton declined from the first to the third debate,
- State-level Google search trends show that swing and bluer states tend to have had a higher interest level in Trump relative to Clinton,
- State-level Google search trends show that relative interest in Trump versus Clinton grew the fastest in swing and bluer states,
- The surge in interest for Trump, as measured by the increase in relative searches for Trump, though not reflected in state polls, can be partially explained by Social Desirability Bias which would have explain potential Trump supporters searching for more information in private while not admitting to such activity in public or in public polls,
- State-level demographics show that the swing states that experienced the greatest growth of interest in Trump relative to Clinton also have the most Trump-supportive demographics, measured by a variety of variables but centered on the relative size of whites without college degrees to the state’s population,
- The surge in interest for Trump could be partially explained by the whites without college degrees searching for him,
- Google search trends and demographics help to identify which states could produce very out-of-consensus pro-Trump voting behavior on election-day,
- Assuming very high turnout from the whites without college degrees demographic and incorporating the state-level Google search trends and demographic information shows that this race is extremely tight, much more so than current polls show,
- Google search trends help in forecasting state-level results, especially when used to confirm or deny current poll information and analyst talking points,
- The current base case of a resounding Clinton victory from almost all well-known political analysts would have extreme difficulty incorporating the facts that Google search shows Trump ahead in terms of absolute and relative growth performance, thereby (if you believe that Google search trends are important indicators for election forecasting) calling into doubt the Clinton landslide forecasts and the prevalent +90% probability of a Clinton victory models.

