Election 2016 Forecast / Turnout and Result: Google Search Trends can Predict Turnout and Election Winner
People mostly get their information from search. If they are interested in something they tend to open a browser and search for the topic at hand. Google, by most accounts, controls over 60% of search in the US making it the dominant platform. Google also makes public its search trends such that you can enter key terms and see how search for that term has trended over time and then also in comparison to other terms.
We can look at names of politicians during election years to see how those trends developed around elections. Generally what becomes apparent is that those:
- Politicians with consistently higher levels of search tend to win the election,
- Elections with small differences in search trends between candidates tend to produce tighter races and those with large differences tend to produce races decided by a wider margin, and
- Elections with higher aggregate level of search for the main candidates tend to produce higher voter turnouts.
Assuming you agree that search trends indicate interest in a candidate and in voting, then these statements should be fairly commonsensical.
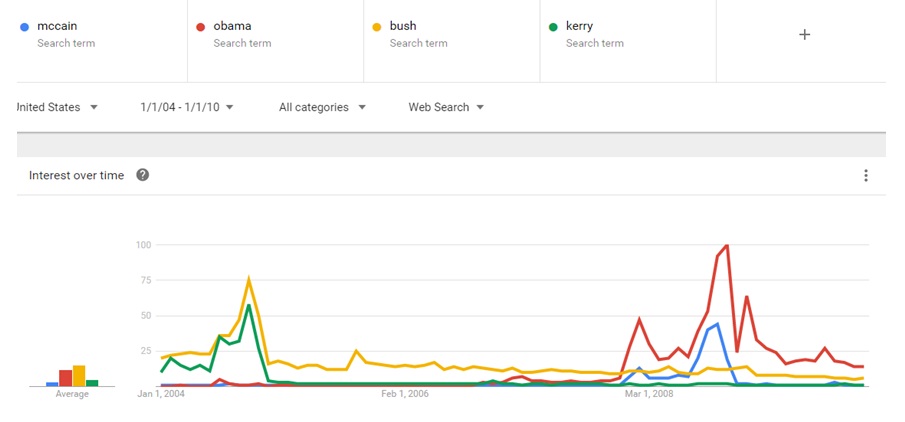
Google trends does not show absolute values but relative ones. So, it will always set the highest point to an index of 100 and then compare all other points to that index. In the case of US politicians from 2004 to present, the index is set for Obama in November of 2008, or the month of his first term win over McCain.
The following chart shows the 2004 and 2008 elections with the search trends for the main candidates. In 2004, we can see how searches for Bush dominated those for Kerry throughout the campaign and that the search trends were fairly close together. The result was that Bush won the election by a relatively small margin – 286 electoral votes to 251. Voter turnout was relatively high at 55.27%.
The 2008 search trends give Obama a more obvious advantage. Obama peaked at a level much higher than Bush or Kerry from the previous election and McCain, his opponent, paled in comparison. The result of the election was a fairly wide electoral victory for Obama – 365 electoral votes to 173. Voter turnout hit 58.23%, or the highest level in a generation, last exceeded in 1968.
Chart 1: Google Search Trends for US Presidential Candidates 2004 and 2008
Source: Google Trends
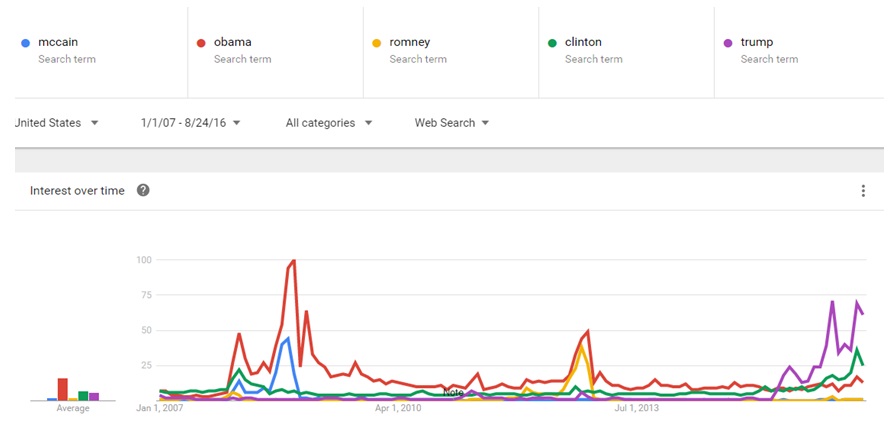
Similar results are depicted in 2012 as can be seen in the following chart. Search trends for Obama dominated Romney throughout the race but the trends are fairly similar and much tighter than in 2008. The result of the election was a victory for Obama but it was a tighter race than in 2008 – Obama finished at 332 electoral votes to Romney’s 206. The aggregate search trends of the candidates are noticeably lower than in 2008. Voter turnout declined to 54.87% or lower than in 2004 or 2008.
The general pattern seems to be set as outlined previously. Using the last three elections as samples, it clearly seems that candidates with consistently higher search trends win the election, that the margin of victory tends to correlate to the difference between the search trends of the candidates, and that voter turnout tends to move in-line with aggregate search trends of the candidates.
This sample size is small. This is the greatest weakness in using this data. However, search has been and continues to be the most important means of people discovering information about candidates from approximately when the data begins (2004) to present. Furthermore, the fact that all of the previous elections show similar tendencies in determining the winner, the margin of victory and voter turnout, it does not make sense to not include this data in election forecasting.
Chart 2: Google Search Trends for US Presidential Candidates 2008, 2012, and 2016
Source: Google Trends
The most important question is how will these same trends impact the current election? Search trends for Trump have dominated those for Clinton. Using historical precedent, it implies that more people are interested in Trump and implies victory in the election. Also, we see that the degree to which search trends for Trump dominate those for Clinton is significantly greater than in 2004 and 2012, implying that electoral victory will not be that tight – in other words search trends are currently implying that the race will not be as tight as in either 2004 or 2012. We can also see that both search trends for both candidates are extremely high for this stage of the election as compared to previous elections which implies a higher voter turnout. It should be noted that in previous elections, search trends spiked higher in September, October and November, so judging from current levels, the 2016 search trends should exceed Obama’s previous record in 2008.
Summarizing, search trends are calling for a Trump victory in a not-so-tight race with record turnout.
Now let’s look at some of the data broken down so that we can analyze it. The following table shows the highest search trends rating (always using the index of 100 for Obama in November 2008) to July of that year. Some years, the highest search for a candidate was in July and others it was during the primaries. We are looking for peaks to determine level of interest by the general public in the US.
Table 1: Google Search Trends for each candidate, highest monthly trend year-to-date during that election year for the candidate, based off of 100 index of Obama in Nov 2008
| Republican Candidate | Democratic Candidate | |
| 2004 | 35 | 31 |
| 2008 | 13 | 47 |
| 2012 | 9 | 15 |
| 2016 | 69 | 36 |
Source: Google Trends
Note: Numbers bolded show the candidate who eventually won the election, in each case it was the candidate with a higher search rating.
There are a number of points that jump out from the previous table. First, the search trends for both the 2016 candidates are relatively high as compared to other years. Clinton, though trailing Trump, still beats all other candidates except for Obama in 2008. High search for both candidates implies a very high level of voter interest in this election and further implies eventual high voter turnout.
Second, Trump’s highest search rating up to July is higher than that of Obama’s to July of 2008 – this implies that search trends for Trump will likely peak in November 2016 at a higher level than for Obama in November 2008. If historical trends follow, this should result in record turnout for this generation.
Third, the difference between search ratings for Trump and Clinton in relative terms is not as tight as in 2004 but not as wide as in 2008. This implies that the race should likewise not be as tight as in 2004 but not as wide as in 2008 in terms of margin of victory.
Fourth, it should be noted that the candidate to July of the election year with the higher search trends eventually won the election. This was true in 2004, 2008 and 2012. The fact that search for Trump is so much higher than Clinton implies holding historical trends constant that he will win in November.
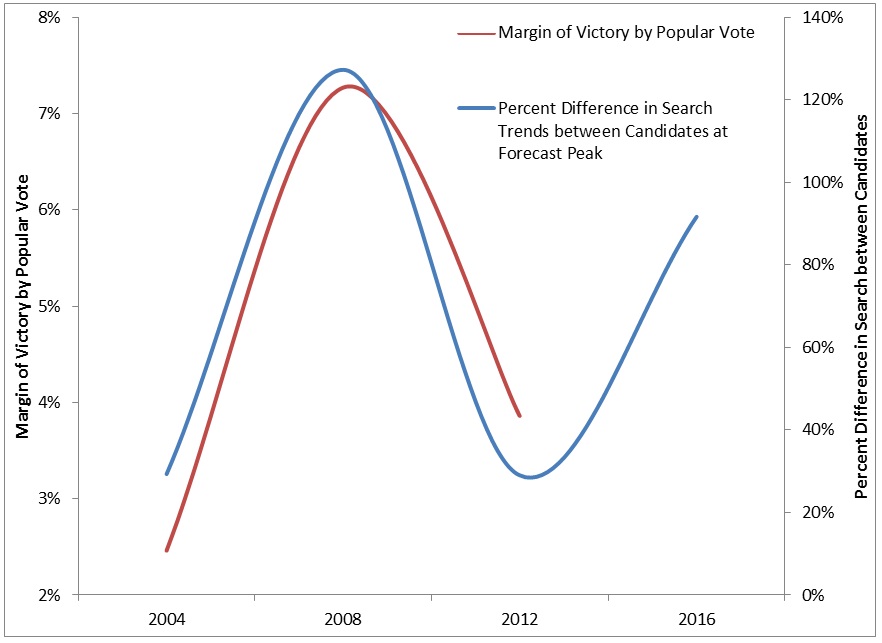
Chart 3: Comparing US Presidential Margin of Victor by Electoral Vote to Difference between Google Search Peaks for each Candidate
Source: Google Trends
The last three presidential elections show a fairly similar pattern of search trends being able to indicate the approximate margin of victory. There are still unknowns for the 2016 race including if Trump can maintain his lead over Clinton to the same degree. However, if the current trends continue it would imply a Trump victory by something like 5-6% over Clinton. This would translate into a likely Electoral College victory by over 100 electoral votes. Such a scenario would have Trump winning all or almost all of the swing states and many of the rust belt states. Given current polls this is an extremely out-of-consensus call.
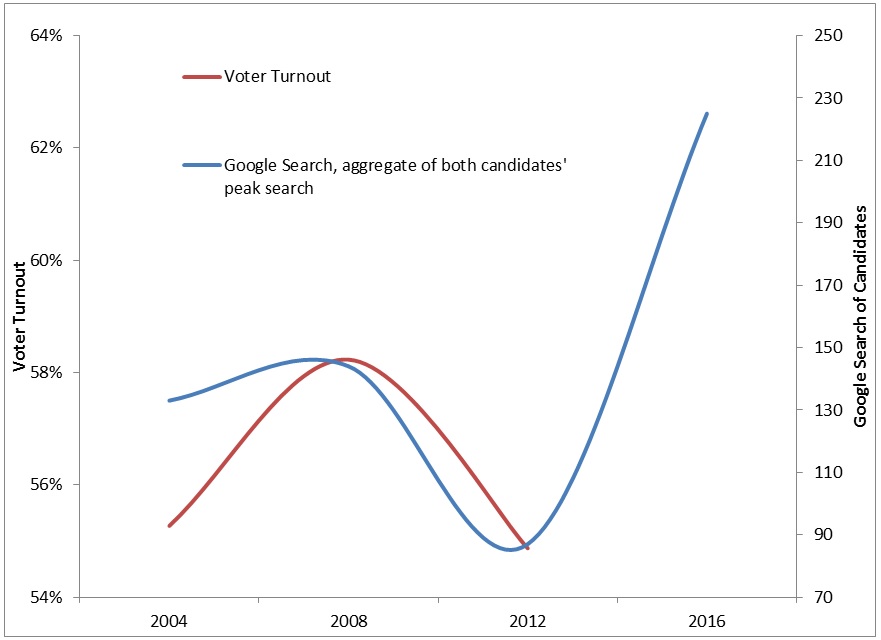
Next, let’s look at how actual voter turnout charts against the aggregate search rating peak for both candidates during an election cycle. The idea is simply that search indicates enough interest to vote, so higher search levels should translate into higher voter turnout. This has worked in the previous three elections and I don’t see a reason why it would not continue. In 2016, as previously stated, both candidates are getting exceptionally high searches which imply that voter turnout should be higher than in the past.
Chart 4: Comparing Voter Turnout and Aggregate Search for both Candidates
Source: Google Search
This analysis depends on current trends remaining intact and on general trends from previous elections to replicate in the current cycle. Specifically, in order to make a forecast for a peak search for 2016, a forecast was necessary for November 2016 which was based off of the current search for the candidates and off of how much search trends increased from July until the election in November. There is no reason to believe any of these would change significantly during this election cycle but it is possible.
Using historical patterns and the aforementioned forecasts, we can see that the projected aggregate search for the candidates in 2016 should far exceed any of the previous years, even 2008. Voter turnout should follow this same trend and hit a new generational high. Forecasting a level is difficult but judging from this chart, I would say most likely higher than 60%. Reaching 63%, which looks very conceivable on this chart, the voter turnout would essentially tie the post-19th amendment record.
We looked at how Google Search Trends can be used to analyze and forecast election results. The strength of this analysis is that it uses data that shows natural interest levels in the candidates by the general populace. In this sense, it is based on very commonsensical assumptions. Also, it has worked very well in historical elections. The weakness of this analysis is lack of long term historical data. We only have three historical elections to deal with which could lead to distortions.
Making a forecast based only on this data I would say Trump will win by popular vote margin of 5% – 6% on generational high voter turnout of 60% – 63%.


