Election 2016 Extremely High Undecideds benefit Trump
One of the most significant wild cards in the 2016 election is the high number of undecideds. Much of the race will be decided by which side they vote for on election-day. This post presents the size of this cohort and speculates on how it can impact the final vote tally. The conclusion is that Trump is both the main reason for the high undecided level and the beneficiary of same. In other words, one of the expected explanations for a ‘surprising’ Trump performance will be undecideds breaking for him on election-day. As the number of undecideds is much higher than commonly known, this, among other factors, will likely produce a massive dislocation from polls in Trump’s favor.
The focus of this post is Google Consumer Surveys (GCS), or more specifically the Google Surveys 2016 US Election Poll. It was chosen for a variety of reasons but mostly because of its unusually large sample size, because there is a comparable poll from 2012 for comparison, because filters are not used to exclude many individuals prior to the poll, because it allows respondents to choose ‘undecided’ easily, and because it provides unweighted data.
For instance, the last updated poll had 24,316 respondents. As most other election polls range from anywhere between approximately 1,000 and 3,000, this GCS poll provides a far larger sample size that allows for more accurate analysis when breaking the data into smaller cohorts such as by state, sex, age and gender. So, in terms of size, it would be difficult to find one better for comparative study or for drill-down analysis.
In terms of unfiltered responses, the GCS poll also is an excellent choice. Many polls do their best to diminish ‘undecided’ responses. They will start by excessively filtering the sample in an attempt to ensure those with voting opinions partake in the poll. Other polls also ask follow-on questions such that if someone tries to respond ‘undecided’ they will be prompted by more questions to try to get them to respond otherwise. In the GCS case, they include all respondents who state that they will vote or are extremely likely to vote, and do not rely on other factors like registration. Also, GCS allows respondents to quickly click ‘undecided’ with no follow-on questions.
Lastly, the fact that GCS provides unweighted data is very useful. Almost every other poll that offers data to the public provides weighted data which has been manipulated in mostly a non-transparent way. For more discussion on the GCS, you can refer to their White Paper.
For the aforementioned reasons, the GCS poll data, especially as compared to other 2016 election poll data, shows impressively unfiltered unweighted data which openly allows people to respond ‘undecided’ at their own choice. In other words, the data is excellent for the task at hand.
In terms of comparison with 2012, the 2016 data shows an unusually high ‘undecided’ level. The final CGS poll from 2012 showed approximately 10.0% undecided. In reality it showed 11.5% ‘undecided plus third party’, so correcting for approximately 1.5% third party share of the final vote, we can estimate an approximate undecided level of 10.0%. The 2016 poll data as of October 31, 2016 shows an undecided level of 18.9%. In reality, this 2016 level likely exceeds 20% if you assume that other undecideds actually responded Johnson or Stein. In short, the undecided level in this election is somewhere around double what it was in 2012.
In some ways you might expect undecided responses to be higher in 2016 due to the fact that an incumbent is not running. There could be a partial effect here, but it does not seem likely as Clinton is a quasi-incumbent. She has already been in the White House as First Lady, served at high government posts, ran for the nomination in 2008, and is considered, according to Forbes, the second most powerful woman in the world. Additionally, pundits have been discussing a Clinton follow-on presidency to Obama for years. In other words, the US electorate recognizes Clinton as a national politician and should not need that much extra time to make a decision. If they have not decided to support Clinton within a week of election-day it could spell trouble.
As covered in other posts, it seems like the real reason for the high undecideds is due to Social Desirability Bias. Trump has become the social unacceptable candidate for a variety of reasons and there appears to be an incentive, larger than in previous elections, to not be caught publically supporting him. This has produced an exceptionally high number of undecideds just a few days before the election.
For those of you interested in the dynamics, it appears that in a live interviewer based poll many respondents would tend to change their answer to another candidate to avoid the socially undesirable candidate if not given an easy way to declare undecided. As the GCS poll offers this option without fanfare, those open to bias appear to hide there as their first choice.
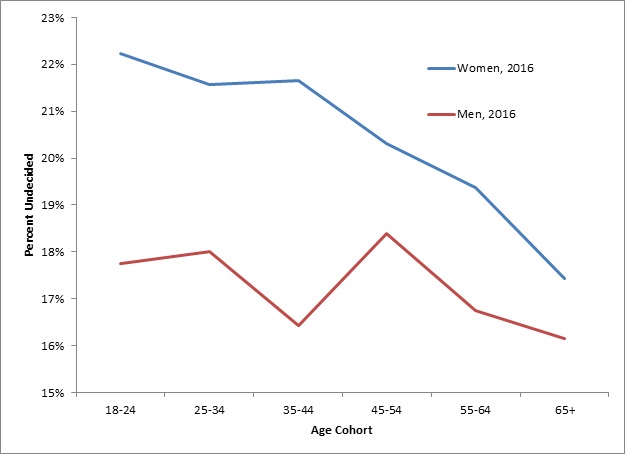
Breaking this data further by sex, we can see that women are posting higher undecided levels in 2016. This goes completely against the Democrat campaign messaging which attempts to create a pro-woman stance for Clinton and an anti-woman stance for Trump, or at least tries to create images of same. The fact that women are more undecided is a major strike against Clinton.
Chart 1: Google Consumer Survey, Election 2016 Poll, Undecideds by Sex and Age Cohort
Source: GCS, Coogan
As can be seen from the previous chart, every age cohort has a higher percentage of women undecided voters. Additionally, the difference is the largest at the younger age groups. Both of these facts are very negative for Clinton as women voters and younger voters were key elements in Obama’s ‘Coalition’ from 2008 and 2012 that helped get him elected. If Clinton, as the first female presidential candidate from a major US party, inspires higher female undecideds it produces a very large question mark regarding how the undecided cohort will end up voting.
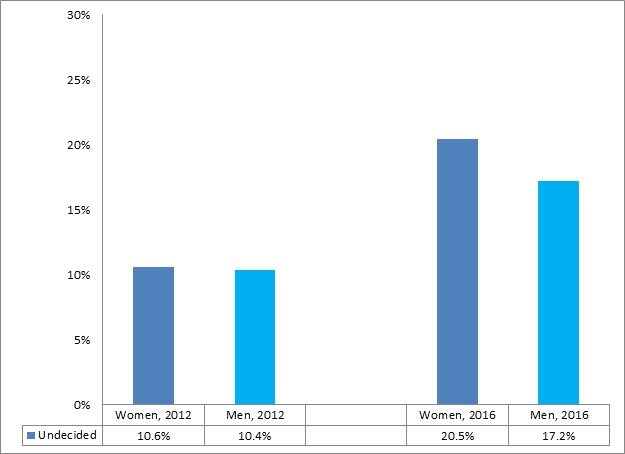
The following chart compares 2016 and 2012 directly.
Chart 2: GCS Election Polls, Percent Undecided, for 2012 and 2016
Source: GCS and Coogan
Note: The GCS data has been changed as it does not offer ‘undecided’ but ‘undecided and third party’ for 2012. As third parties received approximately 1.5% in 2012, the GCS data was corrected for this.
For women, the 2016 level is about two times that of 2012. For men, the difference is still high but considerably lower. Additionally, it is interesting to note that the level of undecided by sex is very similar in 2012 whereas in 2016 the difference is much greater. Again, it does not bode well for Clinton to see such high levels of female undecideds given her campaign’s focus.
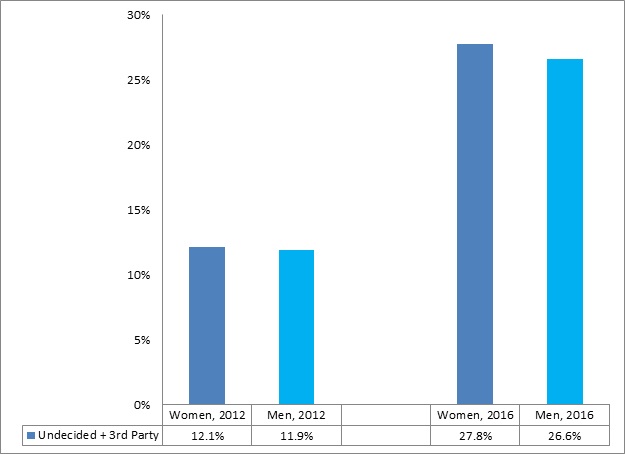
Taking this analysis one step further, we can look at the level of undecideds plus third parties for both years.
Chart 3: GCS Election Polls, Aggregate Percent Undecided plus Third Parties, for 2012 and 2016
Source: GCS and Coogan
This last chart is relevant for a number of reasons. First, once you include third parties, the level of non-main party voters hits over a quarter, within a week of the election. For the US, this is an astoundingly high level. Second, the difference between male and female voters closes considerably in 2016 once you include third parties.
The first point highlights one of the main reasons for this post, that there are still a lot of potential main party voters sloshing around. Further, how these voters break on election-day will likely help to determine the outcome of the race. Considering the fact that the GCS has Clinton up by less than 3 percentage points (and that most non-live interviewer based polls are within the margin of error), an approximate 27% of voters polling for non-main parties is potentially a huge upset in the making.
The second point shows that the difference between the female and male vote closes considerably once you include third parties. This helps to confirm, but does not fully confirm, the theory that many undecided men are ‘hiding’ by declaring support for Johnson and/or Stein. Other posts have covered this concept, so it is not new. This data point just helps to confirm it. The fact that undecided levels by sex were so similar in 2012 leads us to believe that there is no natural tendency for either sex to be more undecided. We could assume that 2016 the starting point would be about the same. For 2016, once including third parties, the levels by sex tend to even out.
Again, we have covered this topic in other posts, but the fact that both Stein and Johnson headed their respective parties’ tickets, with very minor tweaks to their platforms, in 2012 leads us to believe that their percent vote is not likely to explode in 2016 as polls suggest. There are new factors involved in 2016, namely the high unpopularity ratings of both main candidates, but these do not seem like they are significant enough to produce such high protest votes – not when so many believe that this election is the most important in a generation.
Assuming that the GCS undecided level is correct and that approximately 20% of the populace is still undecided puts much of the race still up for grabs.
In 2012, the undecideds more or less voted on a pro-rata basis according to poll results. In other words, the final result of the 2012 race more or less reflects the final poll result for Obama vs Romney. If we assume that around 10% undecided is ‘normal’ in the race and that those 10% will more or less fall in-line with national polls, then the true ‘wild card’ undecided for 2016 would be the approximate 20% minus 10%, or 10%.
A wild-card 10% undecided vote seems to be where a major swing vote resides. This is not being covered by the polls or news. Polls are quoted by the news and used in forecasting models as if such a wild-card did not exist. Again in a race where most anonymous polls show the election within the margin of error, such a wild-card undecided should be making headlines.
The 10% estimate appears to be real voters as GCS uses a sample filter of using those respondents who “self-reported 100% or Extremely likely to vote”. In other words, it does not seem likely that they will stay home.
The next main question is where will these votes end up?
If you think this is a ‘normal’ election, the undecided votes, no matter how high, will likely split more or less along the lines of the existing polls. In other words, it will have little to no impact on the outcome of the race. Under this scenario, Clinton will likely win as she is ahead in the GCS and most polls.
If you think this election could have produced a bias in the polls, then this extremely high level of wild-card undecideds is a clear symptom. In a scenario where respondents feel social pressure to not support a certain candidate, they will, even if planning on voting, keep their choice private and would prefer in many cases to simply respond undecided. In theory, the vast majority of these wild card undecideds would break for the most socially undesirable candidate, or Trump, on election-day.
One piece of evidence supporting this theory is that there are more women declaring undecided than men. As explained previously, it is very odd that in this particular election that so many more women would not have declared themselves already in support of Clinton. We can more or less assume that if they have not done so already, they will likely not end up supporting Clinton. This phenomenon of women publically supporting Clinton in a superficial way was highlighted in previous posts.
Quantifying the degree to which there is a hidden Trump vote among women can be done a number of ways. One way is to compare how polls using different data collection methods differ. Another way is to calculate the ‘excess’ undecided among women in 2016. We saw that the level of undecided men and women in 2012 were almost identical. Then, in 2016 we noticed that the level of undecided among women was significantly higher – 3.2 percentage points higher – than for men. In an election where you think there could be Social Desirability Bias, this appears like a very obvious place to start. These 3.2 percentage points of women will likely not vote for Clinton but for whatever reason are reluctant to state as much and simply sit in the undecided category.
Given that Clinton leads Trump by only 2.6 percentage points in the latest GCS means that a minimal level of hidden Trump supporters in this exceptionally large undecided cohort could shift the election result to Trump.


