With just over a month to go (as of the writing of this) before election-day, PredictWise forecasts a Clinton win at approximately 80%, FiveThirtyEight puts it at 78%, and Huffington Post (after running 10 million simulations) projects an 84% chance. Additionally, most media agencies seem to be soft-predicting a Clinton victory – for example a recent Politico article , Democrats debate the size of a Clinton Victory, discussed if it was better to “… play it safe and focus on beating Donald Trump in the states that will decide the election, or try to run up the score and clobber him”. Talk of a landslide Clinton victory is fairly easy to come across but rare is a projection from a neutral entity of a Republican victory.
With this as a backdrop, the following table includes projections from FiveThirtyEight, from an average of national polls, and from Coogan (me). The Coogan projections are just about as out-of-consensus as you can get as they put Trump not only ahead but meaningful so.
Table 1: 2016 US Presidential Election Forecasts
| Candidate | Party | 538.com | Polls | Coogan |
| Clinton | Democrat | 48.2% | 45.2% | 45.3% |
| Trump | Republican | 43.6% | 42.3% | 48.1% |
| Johnson | Libertarian | 6.9% | 9.5% | 5.1% |
| Stein | Green | 1.3% * | 3.1% | 1.5% |
| Democrat | Margin of Victory | 4.60% | 2.90% | -2.84% |
Source: FiveThirtyEight, RealClearPolitics, ZettaCap, Coogan *Stein’s number is implied by taking the difference from 100% from the data supplied.
The FiveThirtyEight data is taken directly from their site. They have become very well known for having correctly called the 2012 US Presidential Election in all 50 states. Over the last few years, its founder, Nate Silver, has become more or less a forecasting celebrity and regularly appears in the news with commentary on the 2016 election. However, he like almost every analyst and pundit called the 2016 primaries terribly wrong and issued what amounted to an apology, so his track-record this election cycle is less than stellar. Their forecasts, based on proprietary models using polls and other inputs, are lopsided in favor of Clinton. FiveThirtyEight projections represent the quant-driven blind-you-with-cool-math category that has emerged in the post-Freakonomics pop-culture analyst world.
The Polls data is taken from RealClearPolitics. It is averaged over the last month and then the undecided data is allocated to each candidate on a pro-rata basis based on their average poll standings. The Polls category amounts to the collective knowledge of all major national-level polls.
The Coogan forecast is based off of the series of posts you will find on this site and encompass social media activity, Google Search trends, Wikipedia page views, fundamental demographic analysis, anonymous poll data, historical US Presidential election analysis, and Social Desirability Bias. Coogan forecasts are considerably different as they place a higher importance on modern data (social media and on-line activity), anonymous polls (versus more biased live polls), and Social Desirability Bias (the concept that explains why people might change their responses in polls).
The 2016 Election is capable of re-writing much of what we understand as best practices in election analysis. Traditional analysis is based off of polls which are assumed to be accurate and dependable. Most analysts and pundits base their conclusions on polls with little question as to their validity and with little incorporation of alternative data. However, a variety of factors, such as longer term secular trends and the candidates involved in 2016, have produced an environment in which polls have become biased. Assuming the validity of polls has declined would throw off pretty much every traditional model making projections for 2016 inaccurate.
At the same time, the importance of on-line activity has exploded in society but has not been incorporated into election analysis to the same extent. Periodically, you will see some election news coverage regarding social-media, on-line activity, or similar but they are almost universally downplayed providing preference to traditional polls.
The Coogan approach (the one presented here) makes the opposite assumptions – namely that in an emotional political environment such as that of 2016 on-line activity will be less biased than polls, especially those conducted by live interviewers which encompasses by far the majority of the polling agencies. In this environment, it is this newer data which is being mostly ignored by traditional pundits and analysts that has a better chance of providing true insights into the race. If these assumptions are correct, almost all mainstream election analysis, from pundits to betting markets, have misdiagnosed this election and are in for a major shock.
Voter turnout is another area where current forecasts are lacking. In fact, it is extremely difficult to obtain a forecast for turnout, which is somewhat ironic as the general consensus agrees that increased voter turnout from members of Obama’s ‘Coalition’ in 2008 and 2012 played a significant factor in electing him. In other words, all analysts should be very aware that shifts in voter turnout can significantly impact election results, but still appear to be ignoring, or at least downplaying, this in their forecasts.
For 2016, voter turnout should shift more significantly than it has in a generation. There is enormous interest concerning this election as compared to previous elections as measured by a variety of standard poll questions that attempt to measure levels of voter interest and enthusiasm. Such questions ask among other things how closely people are following the election, how important they see this election as being, how often they vote, and how their enthusiasm level compares with that of the previous election. For 2016, these metrics are all making new highs – even exceeding by a significant degree those levels from 2008 which was seen by most as the high water mark for voter interest for this generation. Additionally, on-line metrics such as Google search trends show that the interest in 2016 far exceeds that from the previous three US Presidential Elections. Other indicators include Republicans breaking primary turnout records and mega political rallies that often attract in excess of 10,000 people.
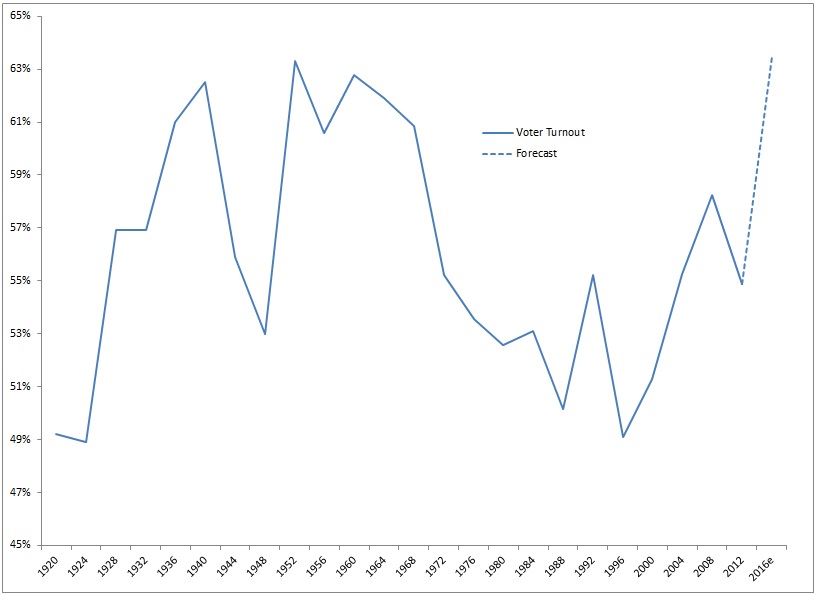
In short, voter turnout by all indications should spike higher in 2016. Furthermore, it should break the most recent high of 2008 by a significant degree. Having looked closely at various indicators of voter interest and enthusiasm it seems like the prior post 19th amendment high could be tested and perhaps slightly exceeded. The forecast together with the historical trend of voter turnout are shown in the following graph.
Chart 1: Voter Turnout for US Presidential Elections, 1920 – 2016e
Source: Wikipedia, Coogan
Voter turnout is forecast to slightly exceed its 1952 high. If this forecast is even remotely accurate, the much higher turnout will seriously impact the race. Most analysts are simply not taking into account such a scenario. They might discuss increased interest as a news item but there is little indication they have been incorporating higher turnout scenarios into their forecasts. Most political analysts appear to be simply taking poll results and inputing them into mathematical models with little to no questioning of the merits of such polls. Such a process helps to create distorted forecasts as polls normally use turnout from previous elections to re-weight the poll responses – this creates a strong positive bias for Clinton as it assumes the structure of voter turnout will replicate that of Obama’s ‘Coalition’ which will doubtfully support Clinton to the same degree in 2016.
Summarizing, the 2016 US Presidential Election is considerably different from other recent elections and such differences are likely distorting traditional election analysis. In this case, we should look at social media, on-line activity, and other alternative data to help to forecast true underlying support for the candidates. A wide gap has emerged, however, in that polls, especially those using live interviewers to collect data, appear lopsided in favor of Clinton whereas alternative data show a significant advantage for Trump. The 2016 election will not only decide the US president but also much of how future political analysis is conducted.

